Awesome Oscillator Indicator – A Momentum Indicator to Find Trends
Momentum Indicators such as the Awesome Oscillator indicator are quite useful to determine the best possible entries in the market using both stocks or call and put options.
Furthermore, using the Awesome Oscillator strategy that is included, we will be able to perform a quite complete technical analysis of the asset.
In this article, we are going to learn everything we need to know to understand and use this tool. We will be seeing the Awesome Oscillator formula, strategy, and approach we should use in order to take the best from it.
So, let us get started!
Table of Contents
What is the Awesome Oscillator indicator?
The Awesome Oscillator indicator is a momentum oscillator. It calculated the difference between a long simple moving average, which will have 34 periods or candlesticks, and a short simple moving average with 5 periods, both over the median price.
We should remember that the median price is calculated by summing the high and the low of the candlestick and dividing it by 2.
Fortunately, this indicator is included in the vast majority of the charting and trading software, just like with ProRealTime in its free version.
In the following graph, we can take a look at the Awesome Oscillator indicator so we can have a better understanding of how it will be working.
In the previous image, we have a 1-hour chart with the Awesome Oscillator indicator represented down in the bottom of the chart.
We will now see how to interpret the indicator.
How does Awesome Oscillator work?
This indicator does have three different ways to be interpreted; each one of them could lead to a different Awesome Oscillator strategy, so we will be breaking down every one of them and show you how to use it to make money in the market.
Awesome Oscillator indicator: Zero line crosses strategy
The main interpretation for the Awesome Oscillator zero line cross is the most simple. By taking a look at the zero horizontal line, we can find two different types of signals:
- Bullish Signal: Occurs when the Awesome Oscillator indicator crosses over the zero line
- Bearish Signal: Occurs when the Awesome Oscillator indicator crosses under the zero line.
Let us take a look at the same graph of the previous example to check how effective this strategy is.
In the previous chart, we can see the zero line crosses marked with a green arrow and an orange square over the price when the bullish signal is triggered.
Alternatively, we will find the bearish signals of the Awesome Oscillator strategy when the red arrow is found on the indicator, and the blue square is painted over the price.
As you can see, the bearish signals in this case tend to be somewhat false signals, and in every case, they suffer quite some lag comparing the indicator to the price. So we should be careful when dealing with this simple strategy.
As an advice, we recommend you to take a look at a higher time frame to determine what is the long term trend and take only signals in that particular direction.
Awesome Oscillator indicator: Saucer Strategy
This second strategy is quite easy to interpret and understand. It is used as a way to reinforce the trend instead of spotting a new one.
- Bullish signal: it would be spotted if the Awesome Oscillator is above the zero line and it changes direction from down to up.
- Bearish signal: it would be spotted if the Awesome Oscillator is below the zero line and it changes direction from up to down.
To understand this a little better, we are going to take another graph again and mark these signals in it.
Again we have marked the bearish signals with a red arrow on the Awesome Oscillator and the bullish signals with a green arrow.
As you can see, the indicator is not very reliable because it will be triggering quite a lot of mediocre signals compared to the first strategy.
Again, we should better spot the long term trend and only take signals in the direction of this major trend to skip and filter those bad signals.
Do you need a fast Stock Trading Journal that helps you make better decisions?In this short video, we will show you how to know in detail the results of your trading, how to get an estimate of the number of stocks to trade based on risk, and how to drastically reduce the time it takes to record your trades with this Journal |
Awesome Oscillator indicator: Twin Peaks Strategy or Divergences Strategy
This might be the hardest signal to find in the indicator as it is not very usual to find.
- Bullish signal: We will find it when a double top or divergence of the Awesome Oscillator is found below the zero line.
- Bearish signal: We will find it when a double bottom or divergence of the Awesome Oscillator is found above the zero line
When dealing with this strategy, think of it as it was an RSI stock divergence or a MACD divergence. Let us take a look at the following graph.
To help us visualize the Awesome Indicator divergence, we have coded it to display a green bar in the indicator when a bullish divergence signal is completed.
In the previous image, we can see two Awesome Indicator divergencies. As you can see, in both cases, while the prices keep falling to a new bottom, the indicator is changing its momentum to the upside, just as is marked with white arrows in the graph.
This strategy is the most reliable as it manages to foresee a considerable price movement but the hardest to find.
Which is the Awesome Oscillator formula?
The Awesome Oscillator formula is relatively easy and straightforward. It is as follows:
As you can see, the Awesome Oscillator formula is only composed of two elements that are subtracted.
As discussed before, the median price is calculated as the differences between the high and the low divided by 2.
Do you need a Calculator that helps you create and analyze any option strategy in record time? |
Last words about the Awesome Oscillator strategy and indicator
The Awesome Oscillator indicator is a momentum indicator whose strategies are useful to identify entry points in the market.
Of the three strategies that we have seen, the most reliable is the Twin Peaks or Divergence strategy, as it will spot the best signals in the market.
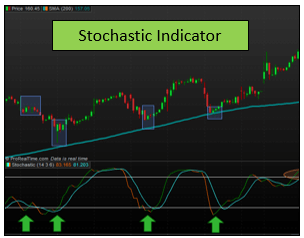
If you are looking for other indicators that signal divergences, we recommend you to take a look at the Relative Strength Index indicator or at the Stochastic Indicator.
In any case, we would recommend you to filter the trend with a trend following indicator with a longer timeframe to avoid false and bad signals in the strategy.
Remember to include some volume trading indicators in your system to find those assets with a low bid-ask spread.
