How to Read ADX Indicator? – Understanding the Power of The ADX Indicator
The ADX indicator is a great tool that will help us analyze when we should follow a trend or when we should wait to enter the market.
The ADX stock indicator is calculated first with other tools such as the directional movement or DM and the directional indicators or DI.
Trying to understand how the ADX indicator is composed could be quite difficult, but we will explain everything we need to know in this article.
Here we will be reviewing the ADX, the DM, and the DI, how to read ADX indicator after calculating everything we need, and some examples, so you understand how to use it properly and whether use or not in your own trading system.
Let us get into it!
Table of Contents
What is the ADX indicator?
The ADX indicator is a trend follower method that will help us identify trends when they have enough velocity to be considered a good trend.
Let us take a look at how the ADX indicator is displayed in a japanese candlestick price chart.
The ADX indicator is composed of one single line, which is a momentum indicator.
This indicator is created from several calculations made, started from the Directional Movement Index. So, we are going to explain how is the ADX indicator calculated step by step.
Do you need a fast Stock Trading Journal that helps you make better decisions?In this short video, we will show you how to know in detail the results of your trading, how to get an estimate of the number of stocks to trade based on risk, and how to drastically reduce the time it takes to record your trades with this Journal |
How is ADX indicator calculated?
First of all, we need to define the Directional Movement Index, a tool that will tell us if the range of the day is outbound from above or below, compared to the previous range of the day.
What is ADX DMI indicator?
Step 1: We will identify the Directional Movement comparing the price range of today with the price range of the previous candlestick. We will obtain two possible parameters
Step 2: After this, we need to calculate the True Range
Step 3: We will need to calculate the Directional Indicators, which will allow us to compare different markets through a percentage of the True Range.
Step 4: After the previous step, what is usually done is to smooth the DI+ and DI- with a moving average. We will obtain two lines that create the Directional Movement Index. Take a look at the following graph.
At the bottom of the chart, we have displayed the Direction Movement Index. The green line represents the DI+, while the red line represents the DI-. Both have already been smoothed with a 20 moving average.
Lastly, the histogram is nothing more than the DI+ minus DI-, so we can have a much more visual perspective about which trend is the dominant in the market.
In other words, if the histogram is green, the trend is bullish, while if the histogram is red, we have a bearish trend.
Do you need a Calculator that helps you create and analyze any option strategy in record time? |
The ADX indicator formula
Finally, in order to calculate the ADX indicator formula, we need to take a last step. At its core, the ADX indicator tries to measure the interval between the smoothed DI+ and the smoothed DI-.
It is calculated as follows:
Step 5: Calculating the ADX indicator formula
As you can see, the last step will also apply a smothering in the DX formula, obtaining thus the ADX indicator.
The ADX indicator is represented with a yellow line. If we happen to be in a persistent trend, the differential between the DI+ and the DI- will increase, and the ADX indicator will increase too.
However, if the market is flat or its trend is changing, the ADX indicator will decrease. So, in other words, we should only follow the trend when the ADX is growing.
Fortunately, this indicator is included in the vast majority of the charting and trading software, just like with ProRealTime in its free version.
How to read ADX indicator? – ADX indicator strategy
Reading the ADX indicator can be somewhat complicated because of the many pieces of information that it provides us. In this section, we are going to give you a few rules you can follow to make the best from this tool.
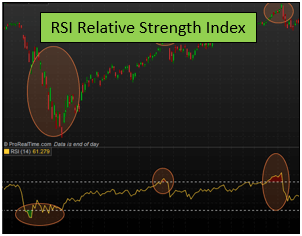
These could serve as an ADX indicator strategy, but we always like to consider this tool more as an informative market gauge indicator rather than a “take action” indicator, unlike other tools such as the stochastic indicator or the RSI stock indicator.
ADX indicator strategy: How to trade with ADX indicator
Using the DI+ and DI- as trend followers
Our first recommendation is to only trade long positions when the DI+ is over the DI-, or in other words, when the histogram is positive.
Again, we should only take short positions when the histogram is under the zero line.
In the previous graph, we have eliminated the DI+ and the DI-, leaving only the histogram and the ADX indicator, so you can easily spot the directions given by the indicator.
Interpreting the ADX indicator in the strategy
If the ADX is falling, we should be cautious, as this is a signal telling us that the market is losing its trend. In these cases, it is better if we do not use any trend follower method.
Again, if the ADX falls under both DI lines, this means that we are entering a dormant market. We should remain vigilant in these cases because most of the stronger trends come from these calm periods.
In the previous chart, we can see the ADX indicator represented with a yellow line when it is climbing and with an orange line when it is falling.
According to our rules, we should not trade when the orange line appears, but we should be vigilant too, because the ADX indicator is under both DI lines. As you can see, a strong movement at the end of the marked is present in the prices.
These are the rules we should follow when we use the ADX indicator, as they will provide us with the best possible ways to make money in the market.
Last words about the ADX indicator
As we have seen, the ADX indicator is a combination of other calculations made starting from the Directional Movement Index.
The ADX indicator is better used in a daily chart, as it will provide better information regarding the state of the asset we want to watch. However, sometimes, the indicator can be quite confusing because it provides too much information.
We do not particularly recommend the ADX indicator for trading because we believe there are better tools out there to spot strong movements, such as the TTM Squeeze indicator.


