What is the TTM Squeeze indicator? – A Full Guide To Understand How To Use One of The Best Momentum Technical Indicators
The TTM Squeeze indicator is one of the most useful momentum indicators we can use in the market to help us identify the entry and exit point in a trading system.
In this article, we will be reviewing the TTM Squeeze momentum indicator, how to use it to make better trading decisions, and how we should interpret it.
Of course, we will be touching on the TTM Squeeze indicator strategy as well as the best time frame for TTM Squeeze so you can use it in your own trading.
So, let us get into it!
Table of Contents
What is TTM Squeeze indicator exactly?
The TTM Squeeze momentum indicator is a technical indicator that tries to determine if the market is in a consolidation period or if it is about to break out and make a move in one direction or another.
To do so, the TTM Squeeze momentum indicator uses a binary system to show us if the market is ready to move or not, combined with the reading of the momentum that will tell us the most likely direction that the stock is going to make.
Even as this may sound confusing, let us take a look at the TTM Squeeze momentum indicator applied in the ProRealTime trading software itself to have a better perspective about it.
This is a japanese candlestick chart coming from the Nasdaq ETF, called QQQ, showed in a 15 minutes chart and with the TTM Squeeze displayed at the bottom.
How to use the TTM Squeeze indicator
To show you how to understand TTM Squeeze indicator, we are going to be analyzing how to use it with much more detail. Let us make some zoom to the indicator
How to read TTM Squeeze indicator: Consolidation or Squeeze
In the TTM_Squeeze, we have a horizontal line that changes color between the green and the red. This represents the situation of the market in the current moment.
If we happen to found that the TTM_Squeeze horizontal line is in red, it means that the market is in a consolidation period, and it is NOT ready to move just yet.
However, if we finally spot a green dot after a series of red dots in the middle line, this means that the market is finally ready to move, and it will most likely do it in a somewhat aggressive way.
But the question that remains is: In which direction?
How to read TTM Squeeze indicator: Determining the direction of the squeeze momentum indicator
The indicator also shows us some vertical bars that try to follow the direction of the market trend. So, to determine the direction, we will only need to pay attention to these bars.
If we happen to find some yellow or light blue bars that are constantly directed toward the positive field of the indicator, we are most likely in a bullish trend.
However, if we find dark blue or red bars directed toward the negative field of the TTM Squeeze momentum indicator, we might be facing a bearish trend.
TTM Squeeze trading strategy
Okay, now that we know and understand how does the TTM Squeeze momentum indicator works, let us take a look at some examples.
This is the stock chart from Tesla in a 15 minutes time frame and with the TTM_Squeeze indicator displayed at the bottom.
In the chart, we have marked the three squeezes that the indicator shows us. Let us breakdown one by one.
- The first squeeze is quite clear. It is marked on the left side of the chart with a red arrow. As you can see, if we follow the TTM Squeeze indicator strategy, this one is telling us that there is a movement ready to go in the stock, and it will most likely be bearish, as the dark blue bars appeared exactly with the squeeze.
- However, the second squeeze direction is not so clear. Even when we have spotted that there is going to be a movement, the TTM Squeeze momentum indicator tells us that it will most likely be a bearish one. But the truth is that it ended being a bullish squeeze. In any case, this is a perfect example in which we should be using stop loss orders to avoid extreme losses.
- The third squeeze, even when it takes some time to finally move, does it to the upside.
In any case, the three squezees in the graph have actually been successful in determining a large movement in the stock price, and that is the reason why this indicator is so powerful
Do you need a fast Stock Trading Journal that helps you make better decisions?In this short video, we will show you how to know in detail the results of your trading, how to get an estimate of the number of stocks to trade based on risk, and how to drastically reduce the time it takes to record your trades with this Journal |
Does TTM Squeeze work?
We can easily say that this indicator not only works, but it works extremely well, and since we discovered it, we have been using it in every single trade.
The TTM Squeeze strategy is one of the best we have ever used.
Why is the TTM Squeeze momentum indicator so accurate?
One of the main questions we could ask ourselves is about the accuracy of the TTM_Squeeze when it comes to determine the movements in the stock.
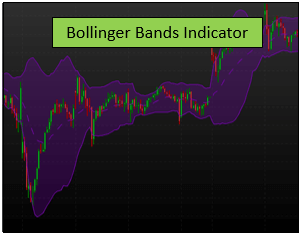
The reason for the TTM Squeeze accuracy is that the indicator uses the volatility to determine a possible squeeze in the market. We are referring to the use of the Bollinger Bands and the Keltner Channels indicators simultaneously.
Basically, when the Bollinger Bands begin to get tight, and they manage to fit inside the Keltner Channel, we are facing a consolidation period, and thus, it is very probable that we will find a strong movement in the following candlesticks.
Here you can take a look at the Bollinger Band and the Keltner Channel, both displayed simultaneously.
When the Bollinger Bands manage to fit inside the Keltner Channel, the TTM Squeeze momentum indicator will turn to green, and that is why it is so accurate.
How to setup TTM Squeeze indicator?
As we have previously explained, the TTM Squeeze indicator is composed of the Bollinger Bands and the Keltner Channels, so it is no surprise that the parameter we need to set up for the indicator are related to these two tools.
When we display the TTM Squeeze, we will need to adjust mainly four parameters, which are the length and the standard deviation of the Bollinger Bands and the length and deviation of the Keltner Channel.
The usual thing to do is set these parameters as 20 periods as the length of both indicators and establish a 2 standard deviation for the Bollinger Bands and a 1.5 standard deviation for the Keltner Channels.
If your trading platform does not include the TTM Squeeze indicator, you can donwload our free technical indicator repository for ProRealTime that includes this and other useful indicators. You can access it for free along with our Free Stock Trading Guide here:
The best time frame for TTM Squeeze momentum indicator
The TTM_Squeeze works exceptionally well in every single time frame we want to use. We have found it very accurate in all of them.
The only advice we can give you to find the best time frame for TTM Squeeze is to try it for your own.
For example, we have found it to be very useful on the 5 minutes, 15 minutes, and 4 hours time frames.
Do you need a Calculator that helps you create and analyze any option strategy in record time? |
Last words about the TTM Squeeze momentum indicator
As we have seen, the TTM indicator is a quite complex but extremely useful indicator, as this one will tell us if the stock is about to make a movement and in which direction.
The TTM Squeeze momentum indicator is one of those that we should always have at hand to make better trading decisions, as it will help us to improve our market timing and obtain better profits. We find it very useful when we use it along with the RSI Relative Strenght Index indicator too.


