Heikin Ashi Candlestick: Unveiling the Trend in the US Market
Heikin Ashi candles, widely used by traders, are a popular indicator for trend detection. Their visual clarity and ability to highlight whether prices are rising or falling have made them increasingly favored.
While opinions on their effectiveness vary, proponents argue that Heikin Ashi candles provide clear graphical representation of market direction, strength, and momentum. Combining them with other indicators, such as the simple moving average, can reinforce trading strategies and facilitate trend identification.
Critics, however, contend that Heikin Ashi candles may not accurately depict price movements, potentially distorting information. Despite these differing views, Heikin Ashi candles can be useful in capturing trends, identifying inflection points, and managing profits in trading.
What are Heikin Ashi Candles?
Heikin Ashi candles are a popular tool used in technical analysis to identify trends in the financial markets. They provide a unique representation of price movements, offering traders a clearer visual understanding of market direction and momentum.
To understand Heikin Ashi candles, it’s important to know that “Heikin Ashi” is a Japanese term that translates to “average bar.” These candles are derived from Japanese candlestick charts but incorporate a modified calculation method to smoothen the price data.
Unlike traditional candlestick charts, where each candle represents the open, close, high, and low prices of a specific time period, Heikin Ashi candles use an averaging formula based on the previous candle.
This results in a more smoothed out representation of price changes, filtering out some of the noise in the market.
Heikin Ashi candles are color-coded to indicate whether the market is in an uptrend or a downtrend. In an uptrend, the candles are typically green or white, while in a downtrend, they are red or black.
This color scheme helps traders quickly identify the prevailing trend at a glance.
These candles provide valuable insights into market dynamics by focusing on the overall trend rather than individual price fluctuations. Traders can use Heikin Ashi candles to identify trend reversals, confirm existing trends, and make more informed trading decisions.
The Basics of Heikin Ashi Trading Strategy
Heikin Ashi candles excel at showcasing trends in the market. The visual clarity provided by these candles allows traders to identify the direction and strength of a trend more easily. The color transitions of Heikin Ashi candles indicate shifts in momentum, making it simpler to spot when a trend may be losing steam or gaining momentum.
By analyzing the sequence of candles and their respective bodies, traders can gain valuable insights into the current market trend.
Identifying Reversal Points with Heikin Ashi Dojis
Heikin Ashi Dojis, characterized by small bodies and long wicks, play a crucial role in identifying potential reversal points in the market. These candlestick patterns suggest indecisiveness or a potential shift in market sentiment.
When Dojis appear in key support or resistance zones, traders may anticipate a reversal in the current trend. By closely monitoring the formation of Dojis and their interaction with previous candles, traders can enhance their ability to identify profitable entry or exit points.
Using Heikin Ashi Candles to Let Your Profits Run
Heikin Ashi candles offer a unique advantage when it comes to managing trading profits. Their smoothed representation of price movements helps traders stay calm and avoid premature exits during volatile periods.
A simple tactic involves exiting long trades when a bearish Heikin Ashi candle forms, indicating a potential trend reversal. Similarly, short trades could be closed when a bullish Heikin Ashi candle appears.
By letting profits run based on the appearance of these candles, traders can potentially maximize their gains while minimizing unnecessary market noise.
- Calculation and Interpretation of Heikin Ashi Candles
- Understanding Trends with Heikin Ashi Candles
- Identifying Reversal Points with Heikin Ashi Dojis
- Using Heikin Ashi Candles to Let Your Profits Run
Incorporating Heikin Ashi Candles with Other Indicators
When using Heikin Ashi candles as part of your trading strategy, it can be beneficial to combine them with other indicators to enhance their effectiveness.
By incorporating additional indicators, you can gain more insights into market trends and make more informed trading decisions.
Combining Heikin Ashi Candles with Simple Moving Average
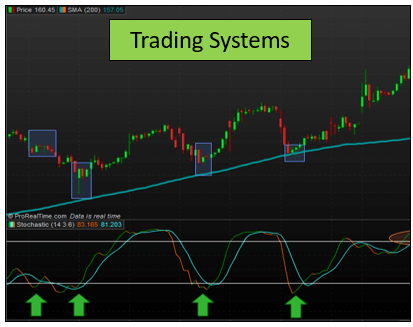
One popular approach is to combine Heikin Ashi candles with a simple moving average (SMA). The SMA helps to smooth out the price data and provide a clearer picture of the overall trend.
By overlaying the SMA on the Heikin Ashi chart, you can easily identify the direction of the trend and potential reversal points.
- Plot the SMA on the Heikin Ashi chart to create a moving average line.
- Observe how the Heikin Ashi candles interact with the moving average line.
- A crossover of the candles above the moving average line may indicate a bullish trend, while a crossover below the line may signal a bearish trend.
Exploring Reversal Patterns with Heikin Ashi Candles
Heikin Ashi candles can also help in identifying potential reversal patterns in the market.
These patterns suggest a change in the prevailing trend and can present trading opportunities.
- Look for specific candlestick formations within the Heikin Ashi chart that indicate potential reversals, such as Dojis or engulfing patterns.
- A Doji candle, for example, represents indecision in the market and may signal a potential trend reversal.
- Combine the identification of these reversal patterns with other technical indicators or price action signals to confirm the reversal and plan your trades accordingly.
By incorporating these additional indicators and techniques into your analysis, you can complement the information provided by Heikin Ashi candles and strengthen your trading strategy.
However, it’s important to remember that no indicator or strategy is foolproof, and it’s always wise to practice risk management and consider the overall market conditions before making any trading decisions.
Do you need a fast Stock Trading Journal that helps you make better decisions?
In this short video, we will show you how to know in detail the results of your trading, how to get an estimate of the number of stocks to trade based on risk, and how to drastically reduce the time it takes to record your trades with this Journal
The Pros and Cons of Heikin Ashi Candles
Heikin Ashi candles offer several advantages when it comes to analyzing market trends and making trading decisions. However, it’s essential to consider their limitations as well. Let’s explore both the advantages and criticisms of Heikin Ashi candles.
Advantages of Heikin Ashi Candles
- Clear Visual Presentation: Heikin Ashi candles provide a visual representation of market direction, strength, and momentum, making it easier for traders to identify trends accurately.
- Trend Confirmation: By combining Heikin Ashi candles with other indicators, such as the Simple Moving Average, traders can enhance their strategy and validate the ongoing trend.
- Improved Trade Timing: Heikin Ashi candles help traders identify potential reversal points in the market.
By paying attention to Heikin Ashi Dojis, which indicate possible trend reversals, traders can improve their market entry and exit timing.
- Profit Management: Heikin Ashi candles can help traders let their profits run by providing a calmer and smoother representation of price movements.
By using Heikin Ashi candles to identify trend continuation, traders can maximize their profit potential.
Criticisms and Limitations of Heikin Ashi Candles
Despite their advantages, Heikin Ashi candles also face certain criticisms and limitations that traders need to be aware of:
- Simplified Price Representation: Some argue that Heikin Ashi candles smooth out price fluctuations, making them less accurate in representing the true market movement.
Traders should consider this limitation and utilize additional analysis techniques for a comprehensive understanding of the market.
- Potential Information Distortion: Critics claim that Heikin Ashi candles may invent or fill gaps in price information, potentially distorting the actual market conditions.
Traders should exercise caution and cross-reference Heikin Ashi candle patterns with other technical analysis tools.
- Dependence on Previous Candles: Heikin Ashi candles are calculated based on the previous candle’s values, which means the accuracy of the current candle depends on the preceding candle.
Traders should factor in this dependency when interpreting Heikin Ashi candle patterns.
Overall, Heikin Ashi candles offer valuable insights into market trends and can be a useful tool for traders.
However, it’s essential to consider their limitations and combine them with other technical analysis techniques for a comprehensive trading strategy. By understanding both the advantages and criticisms of Heikin Ashi candles, traders can make informed decisions and improve their trading outcomes.
Practical Tips for Using Heikin Ashi Candles in Trading
When incorporating Heikin Ashi candles into your trading strategy, it’s important to keep a few practical tips in mind. By following these guidelines, you can make the most out of this powerful tool and improve your trading decisions.
Do you need a Calculator that helps you create and analyze any option strategy in record time?
Demo Trading and Practice
Before implementing Heikin Ashi candles in live trading, it’s advisable to practice and familiarize yourself with their interpretation and behavior. Utilize demo trading accounts offered by various platforms to gain hands-on experience without risking real money.
This will help you develop a better understanding of how Heikin Ashi candles align with your trading strategy and improve your decision-making skills.
Utilizing Heikin Ashi Candles in Different Timeframes
Heikin Ashi candles can be applied to various timeframes, from shorter-term intraday trading to longer-term swing trading or investing. Experiment and analyze the performance of Heikin Ashi candles across different timeframes to determine which ones align with your trading goals and preferences.
Remember, different timeframes may reveal unique trends and patterns, providing valuable insights for your trading strategy.
Considering Fundamental Analysis in Conjunction with Heikin Ashi
While Heikin Ashi candles are primarily a technical analysis tool, it’s essential to consider fundamental analysis alongside their interpretation. Fundamental factors, such as economic news, earnings reports, and geopolitical events, can significantly influence market trends.
Incorporating fundamental analysis in conjunction with Heikin Ashi candles can offer a more comprehensive perspective and enhance your decision-making process.
By keeping these practical tips in mind, you can leverage the power of Heikin Ashi candles effectively in your trading strategy. Remember, continuous practice, adaptability to different timeframes, and a well-rounded approach combining technical and fundamental analysis are keys to successful trading using Heikin Ashi candles.
Common Misconceptions about Heikin Ashi Candles
When it comes to Heikin Ashi candles, there are a few common misconceptions that deserve clarification. Let’s debunk some of these myths and gain a better understanding of their purpose and interpretation.
Debunking Myths about Heikin Ashi Candles
Myth 1:Heikin Ashi candles provide accurate representation of price movement.
While Heikin Ashi candles offer a visual representation of price trends, it’s important to remember that they are derived from the previous candle’s calculations. As a result, they may not reflect the exact price action in real time.
They provide a smoothed-out version of price movements, which can be useful for trend analysis but may not capture every minute detail.
Myth 2: Heikin Ashi candles fill in gaps and fabricate information.
This is not accurate. Heikin Ashi candles do not artificially fill in gaps or invent information within trending segments. They are simply calculated based on the average of the previous candles.
While they may present a more subdued appearance, they aim to provide a clearer representation of overall market trends.
Clarifying the Purpose and Interpretation of Heikin Ashi Candles
Purpose of Heikin Ashi Candles:
- Smoothed Trend Analysis: Heikin Ashi candles can help identify trends with greater clarity due to their visual representation. They provide traders with a smoother view of price movements, making it easier to gauge the direction and strength of the market trend.
- Identifying Reversal Points: Dojis in Heikin Ashi charts indicate potential reversal zones.
These areas can present trading opportunities by signaling a shift in market sentiment.
Interpretation of Heikin Ashi Candles:
- Color Change and Momentum: Heikin Ashi candles change color based on the average calculation.
An upward trend is typically represented by green candles, while a downward trend is depicted with red candles. The size and frequency of these candles can provide insights into the strength and momentum of the trend.
- Trade Exit Strategy: When using Heikin Ashi candles, a simple tactic is to exit a long trade when a bearish Heikin Ashi candle appears and exit a short trade when a bullish Heikin Ashi candle forms.
The calm appearance of these candles can make it easier to let profits run.
By understanding the purpose and proper interpretation of Heikin Ashi candles, traders can make informed decisions and incorporate them effectively into their trading strategies.
…


