Keltner Channel Strategy – Using The Daily Volatility To Create a Quite Reliable And Useful Strategy
The Keltner Channel strategy is quite a simple way to trade either stocks or options in the market.
Even when it is a good signal provider, we should be using it along with other indicators to find better entries and avoid false signals.
In this article, we will discuss what the Keltner Channel strategy and indicator are and how to take the best settings to make money in the stock market. Also, we will be improving the system by using a different Keltner Channel settings of what the standard software programs suggest to us.
So, let us get into it!
Table of Contents
What is the Keltner Channel indicator?
The Keltner Channel is a channel indicator that is created by a simple moving average applied to the typical price of the stock.
For those traders or investors that do not know, the typical price of the stock is calculated by adding the high, the close, and the low of a candlestick and dividing it by 3.
How does Keltner Channel work?
For example, if we wanted to use a 9-periods Keltner Channel strategy, we would be calculating the 9-periods simple moving average over the typical price.
After that, the upper and lower parts that form the entire Keltner Channel are determined by adding or subtracting a simple moving average of daily range (we would use the daily high and the daily low) from the middle line of the channel.
In other words, the width of the Keltner Channel indicator depends entirely on the daily trading volatility. As so, we will be using the Keltner Channel strategy only on a daily basis.
Fortunately, this indicator is included in the vast majority of the charting and trading software, just like with ProRealTime in its free version.
Let us take a look at the following graph in which we have added the Keltner Channel to see how it is like.
In the previous image, we can take a look at how the Keltner Channel indicator will look like in a daily graph. As you can see, the middle dotted line is the center of the channel, while the upper and lower orange lines define the rest.
So, now that we know how the indicator looks like, let us jump directly to learn how to use the Keltner Channel strategy
Do you need a fast Stock Trading Journal that helps you make better decisions?In this short video, we will show you how to know in detail the results of your trading, how to get an estimate of the number of stocks to trade based on risk, and how to drastically reduce the time it takes to record your trades with this Journal |
How to use the Keltner Channel Strategy?
Unlike other indicators, there is only one way to use the standard Keltner Channel strategy as such to open long and shorts.
- Bullish Signal: We will take a bullish signal if the price closes above the upper line of the Keltner Channel.
- Bearish Signal: We will take a bearish signal if the price closes under the lower line of the Keltner Channel.
As you can see, the Keltner Channel strategy is pretty straight forward. Let us take a look at the following chart to help you visualize the entries in the market.
In the previous image, we have spotted three bullish signals and one bearish signals, every one of them marked with an arrow
As you can see, of the 4 signals provided, two of them are false and lead us to bad entries, making us lose money. The reason is that we have not optimized the Keltner Channel settings appropriately.
Keltner Channel Settings and improvements of the Keltner Channel Strategy
In many of the trading software available in the market, the standard Keltner Channel settings are set up the simple moving average to 9 or 14 days. However, setting it up to a 21-period simple moving average, we have managed to spot the best trends and entries in the long term.
Let us take a look at the new Keltner Channel settings in the following graph.
As you can see, the Keltner Channel strategy with a 21-period adjustment is quite a better choice for our swing trades, as it will lead to much better entries and better results in general.
Of the five signals spotted in the graph, only the first bullish signal could be considered false or wrong, but the other four would provide us quite a good profit.
Do you need a Calculator that helps you create and analyze any option strategy in record time? |
Last words about the Keltner Channel Strategy
As we have seen, the Keltner Channel indicator is quite useful when it comes to spot entries to the new bearish and bullish trends of a market.
Applying a longer period to the simple moving average in the daily chart, we will be able to find more reliable signals and better trends than the one that we would found with other Keltner Channel settings.
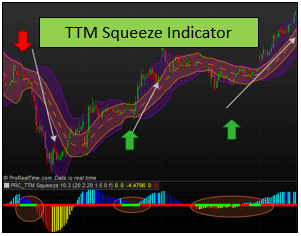
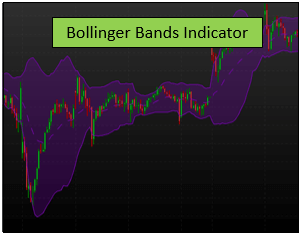
Also, this indicator is very similar to the Bollinger Bands, and combined, they both can create another indicator called TTM Squeeze, one of the most interesting and powerful indicators in the technical analysis.
In any case, as always, we recommend you to take a look at the indicator in your trading platform before including it in your trading system, test it out and configure it out to find the best strategy for you.
