Technical Analysis of Stocks – A Full Guide To Help You Understand On Which Does Technical Analysis of The Stock Market Focus
Whether we trade with stocks, options, futures, or any other asset, learning the technical analysis of stocks is an absolute must if we want to focus on a short timeframe like operating in day trading or swing trading.
Here, we will be learning the technical analysis of stock market, how it works, and how it can help us make money in the short term.
We will also talk about the best technical indicators for day trading and for swing trading, and we will take a look at several examples of technical analysis charts applied in real trades.
So, let us begin then!
Table of Contents
What is technical analysis in stock market?
The stock market technical analysis consists of studying the past data of a particular asset with the idea to predict the future price movement and take advantage of it.
With past data, we refer to the previous price of the asset, including its maximum, minimum, closing, and opening price and the volume of contracts traded during a certain time.
The common tools we will find in the technical analysis of stocks or any other asset are either different chart patterns or different indicators that will help us predict the near future of the price.
Now that we know what is technical analysis in stock market, let us jump to the most important question…
Why technical analysis works?
The reason why the stock market technical analysis of stocks works is because of the psychological patterns of humans. Let us explain this in a little more detail.
When a stock begins to rise or fall, all the investors and traders agreed that the asset’s price deserves to be higher or lower. There is a common agreement that propels the price of the stock to go one direction or another.
This shared agreement is driven by fear or greed, and those emotions are the same in every human being.
For example, in the recent Gamestop rally and decline, we could see those emotions in their pure peak.
The stock price rises such an absurd peak, that when people agreed that it could not go higher, they began panic selling, driving the prices lower and lower, forcing more and more people to sell the stock.
The technical analysis tries to take advantage of the behavior of the vast majority of the people, which is driven by those two feelings, by finding the best moments to join a bearish or bullish trend, or the correct time to buy when everyone is selling and vice versa.
The technical analysis of stocks or any other asset does work because the emotions of fear and greed are so powerful that the behavior of the mass tends to repeats every single time.
Why technical analysis is important then?
The reason why getting started in technical analysis of stocks is so important is multiple.
First, by getting started in technical analysis of stocks, you will learn to buy near the low and sell near the high price, instead of the opposite, which the vast majority do.
Second, you will learn to control your own emotions and act less impulsive in the stock market but in your everyday life, which is crucial.
And third, you will be able to make money in the long run, which most people want to do when giving their first trading steps.
How technical analysis works in stock market?
Now that we understand why technical analysis is important, it is time to learn exactly on which does technical analysis of the stock market focus by using several examples and charts.
The main focus of this discipline is to find anomalies in the price like a moment of weakness in a bullish trend, whether using chart patterns and/or technical analysis indicators and take advantage of them.
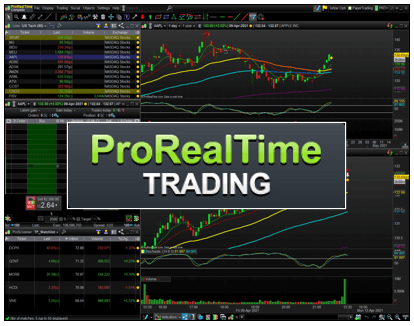
Let us take a look at the two possible ways to use technical analysis of stocks, for example. We are going to be using ProRealTime trading software.
Stock technical analysis chart: Using chart patterns
In the section in which we talked about what is technical analysis of stock market, we explained that we need historical data to forecast the future price of the movement for this discipline to work.
Using chart patterns is the more visual way to getting started in technical analysis of stocks, but it is also the more subjective to use.
There are plenty of different chart technical analysis patterns, such as the ascending triangle or double top in the following graph. Let us take a look at an example of each one of them.
In the previous image, we have spotted an ascending triangle.
This technical analysis chart pattern tends to indicate an upward movement. As you can see, the highest peaks create a horizontal line, while the bottoms keep getting higher and higher, forming a triangle.
When the price attempts to reach the highest point again, there is a high chance of breaking the horizontal line, just like the example above.
In the previous technical analysis chart pattern, we have spotted a double top. It is a typical formation that indicates that the price is going to fall imminently.
As you can see, these chart patterns could be considered to be subjective in many cases, and they are not very easy to spot. However, if we manage to jump into them on time, we will make a decent profit.
Do you need a fast Stock Trading Journal that helps you make better decisions?In this short video, we will show you how to know in detail the results of your trading, how to get an estimate of the number of stocks to trade based on risk, and how to drastically reduce the time it takes to record your trades with this Journal |
Stock technical analysis indicators: Applying technical analysis indicators to the chart
The other way to use the technical analysis of stocks is by using indicators. These tools will help us determine entry or exit signals to take advantage of the price movement.
The technical analysis indicators are important because they are calculated using some mathematical formulas, and we could follow the historical changes of them. Let us take a look at an example.
We have represented a technical analysis indicator called the stochastic indicator in the previous image of the same ascending triangle. This particular tool will tell us if the price of an asset is overvalued or undervalued in general lines.
As you can see, the bottoms of the indicator match with the bottoms of the stock price in the graph.
Here we have the double top formation of the previous technical analysis chart pattern example again.
In this case, we have represented the stochastic indicator also, and in this case, the highest peaks on the technical analysis indicator match with the price.
As you can see, using technical analysis indicators will help us to make a better decision when trading, but sometimes, it is faster to use the chart patterns because the timing is just better.
We prefer focusing on technical analysis indicators, as we find these to be less subjective than a chart pattern.
But of course, choosing your preferred tool depends entirely on you. Either way, you can always mix both styles because they complement each other very well.
Do you need a Calculator that helps you create and analyze any option strategy in record time? |
When to use technical analysis indicators and chart patterns?
Now that we know on which does technical analysis of the stock market focus, the next question would be when we should use it.
Applying stock technical analysis will be useful only in the shorter timeframes in general. We highly recommend you take advantage of these tools in timeframes smaller than one month.
The reason is we can predict how the public will react with more or less accuracy in the shorter term. And an example of this is when the global pandemic appeared in the world.
It was impossible to predict the massive lockdowns from several months before, but it is easy to predict what will most likely happen in the next weeks, days, or hours.
Technical analysis of stocks, in the end, tries to take advantage of the emotions of the general public, and as you know, these can be changing quite abruptly from one day to another.
However, another discipline called fundamental analysis will try to take advantage of the longer timeframes.
Let us take a look at a side-by-side fundamental analysis vs technical analysis of stocks comparison.
How technical analysis is different from fundamental analysis? – Fundamental analysis vs technical analysis of stocks
Fundamental analysis is a discipline that will allow us to take profit from the long-term growth of a particular company.
Typically, the people who follow this discipline are called investors, and they manage concepts as dividends, value investing, growth…
To learn how fundamental analysis works, we need to dig into the company’s different statements: the income statement, the balance sheet, and the cash flow, and we will need to compare the values obtained between the other companies to know which is the best one to buy.
If we compare fundamental analysis vs technical analysis of stocks, with the first one, we are looking for a way to leave our money grow for the long term (usually, more than one year).
However, with stock technical analysis, we will be focusing on making a fast profit from the current situation of the prices of the company.
Let us compared fundamental analysis vs technical analysis of stocks in terms of which is easier to help you make money.
We must say that both disciplines require a lot of time and effort to master, but both will provide you with great benefits in the long run once you have done it.
We prefer technical analysis over fundamental analysis. And the reason for that is that once mastered, it is faster to make some money than fundamentals.
In any case, using both analysis, you will know which stock to buy for a long term perspective, and the most important: when to buy a stock technical analysis
Where to learn technical analysis of stocks for free?
Getting started in technical analysis of stocks is a good way to begin. To help you achieve that goal, we have created a completely free Stock Trading Guide that you can donwload here!
Last words about the stock technical analysis of stocks
In the end, focusing on technical analysis indicators and patterns is like reading the emotions of the general public of investors and traders in the entire stock market.
If we want to learn to make money in the smaller timeframes, we should focus on applying chart technical analysis indicators and patterns. Once mastered, we will be able to make quite a good profits.


