What is The Bollinger Bands Indicator? – An Instrument to Measure The Volatility In The Markets
When we want to measure the volatility of an asset, using the Bollinger Bands indicator could be quite useful to help us know the possible fluctuations of the prices.
In this article, we are going to be reviewing what is Bollinger Bands indicator exactly. We will take a look at how to use the Bollinger Bands, and we will define the parameters we need to set up to correctly display it on our charts.
To conclude, we are going to be comparing the Keltner Channels vs Bollinger Bands to help us understand why both indicator are useful and why are the basis of the TTM Squeeze indicator.
So, let us get into it!
Table of Contents
What are Bollinger Bands in trading?
The Bollinger Bands are a volatility indicator that is based on a moving average. It is formed by adding or subtracting a standard deviation to the middle line to create a channel.
The trick to understanding the indicator is to know that the standard deviation will make the channel bands to be wider or to be narrow, according to the current volatility of the asset we are dealing with.
Let us take a look at how a standard Bollinger Bands indicator looks like when it is displayed on a chart.
The previous japanese candlestick chart displays a 15 minutes chart over the QQQ stock, the Nasdaq 100 ETF. The middle line of the Bollinger Bands is the moving average, which in this case, is a 21-period exponential moving average.
The upper and lower lines that create the channel are calculated with a 2 standard deviations from the moving average.
Now that we know what is Bollinger Bands, let us jump into how to use it.
How to use Bollinger Bands indicator?
First of all, we need to understand that the Bollinger Bands will be adjusting themselves based on the market volatility. So, by using a 2 standard deviation in the parameters, the Bollinger Bands tell us that 95% of the prices of the market must be inside the bands.
What is the reason for affirming such a thing? The reason is that the Bollinger Bands assume that the prices follow a normal Gaussian statistics distribution, also called a bell curve.
In the previous graph, we can see, marked with an arrow and an orange circle, those prices that manage to get out of the Bollinger Bands. The indicator tells us that this situation will only happen 5% of the time.
The common thing to encounter in the market is that the prices will be inside the channel if we assumed a Gaussian distribution ruled over the market.
Bollinger Bands Trading Strategy: Keeping the Market where it should be
To follow along with the concepts we have seen, it should be pretty easy to understand what we should do next.
Just because the indicator assumes that 5% of the time, the prices are out of the channel, the Bollinger Bands trading strategy that we will follow is to reverse trade in those situations where the price is out of the channel.
In other words, the trading system that we should use is this…
- Bullish signal: We will find a bullish signal when the price crosses under the lower band of the channel. When we buy, we are trying to make the price to go back to the channel area.
- Bearish signal: We will find a bearish signal when the price crosses over the upper band of the channel. Again, what we are doing is to make the price go back to where it belongs.
As you can see, the Bollinger Bands trading strategy is quite easy to understand. However, these situations in which the price breakout of the channel are not very common as you can imagine.
Some traders then prefer to use the upper and lower lines of the channel as resistances or supports and trade them in the reverse direction.
As you can see in the previous chart marked with a blue square, if we assumed the upper and lower bands of the channel as resistances and supports, we would have found more signals to trade and making better use of the Bollinger Bands trading strategy.
In any case, that completely depends on the trader to choose which signals to pay attention to.
Do you need a Calculator that helps you create and analyze any option strategy in record time? |
Are Bollinger Bands reliable then?
As you can see, statistically speaking, the indicator is quite reliable, yes. However, nothing is perfect in this world and even less the stock market.
When using the Bollinger Bands trading strategy, we should be aware that the price can be stuck to the upper or lower band for a long time. Let us take a look at an example
In the graph are marked with arrows those periods we have mentioned.
If we have decided to trade where the arrows are displayed, it could have been quite a difficult trades to manage, as the price does not come back to the middle line in most cases, and in many other, the bands keep making new highs and lows.
Which are the most common Bollinger Bands setting to use in the chart?
Typically, if we decide to use the indicator, the standard Bollinger Bands settings will be 14-periods of a simple moving average and a 1.5 standard deviation to calculate the upper and lower bands of the channel.
The truth is, we have found that the best Bollinger Bands settings that work better for us are the 21-periods Exponential moving average and the 2 standard deviation to calculate the channel.
Of course, you are always free to change your Bollinger Bands settings, but we always like to provide you our best experience.
Where to find Bollinger Bands?
In any trading platform such as Metatrader, Prorealtime, or Thinkorswim, Bollinger Bands are going to be available as it is a very common tool to use for traders.
Other ways to display the Bollinger Bands: Bollinger Bands %b
Another way to represent the indicator is by using the Bollinger Bands %b. This indicator is a variant of the main one, and it will try to represent the bands just like the RSI or the Stochastic indicator do.
The Bollinger Bands %b is a bounded indicator. If the price crosses upper the Bollinger band, the %b variant will be equal to 100. The same way will happen if the price touches the lower line of the channel, as the Bollinger Bands %b will be equal to 0.
In this indicator, we can find that sometimes that the value surpasses 0 and 100, indicating that the price is in the 5% zone.
The Bollinger Bands %b variant works exactly the same as the primary indicator, but the difference is only in the way that it is represented. So it might help you a little more to visualize and analyze the current situation of the stock price.
Do you need a fast Stock Trading Journal that helps you make better decisions?In this short video, we will show you how to know in detail the results of your trading, how to get an estimate of the number of stocks to trade based on risk, and how to drastically reduce the time it takes to record your trades with this Journal |
Comparing the Keltner Channels vs Bollinger Bands
The best way to compare the Keltner Channel vs Bollinger Bands is to define each one to understand what they are trying to represent.
As we discussed in the Keltner Channel article, this indicator is calculated by using a simple moving average over the typical price and then adding and subtracting a simple moving average of daily range to create the channel.
In the Bollinger Bands, however, we are creating a channel based on the volatility of the asset and thus, it will be calculated depending on the market situation.
In the previous image, we can see a side by side comparison of the Keltner Channels vs Bollinger Bands.
Now, there is a situation in which both indicator provide a joint signal. When the Bollinger Bands are able to fit inside the Keltner Channels, it is a signal that the next market movement is going to be quite abrupt.
In the previous graph, we can see the joint signal marked with arrows and the following strong movement marked with a green inverted triangle.
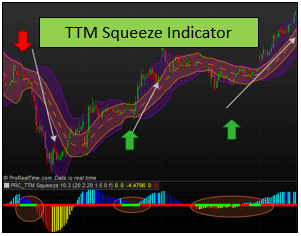
The combination of these two indicators is also called TTM Squeeze, which is an indicator described in much more detail in this article here. There, we explained why the joint signal will help us determine such a strong movement and the foundation of why it works so well.
Last words about the Bollinger Bands
As you can see, the Bollinger Bands are quite a useful tool to help us determine the fluctuations in the market.
Using the Bollinger Bands trading strategy, we will be able to find ourselves more on the winning side of the trades, as we are trading in lower-risk zones compared to other strategies.
Of course, like always, we recommend you to try this indicator by yourself, test it and play with it before adding it to your trading strategy.


