A Guide To Getting Started With ProRealTime Trading Platform
When we begin using new software, it is always helpful to count on a guide to get the thing started.
Here, you will find our ProRealTime beginners guide to help you download the software, change some initial settings, and to add, import, and try different technical indicators, as well as using the different orders and lists.
Before we begin, you can check every single feature ProRealTime provide us in this article here.
Table of Contents
How to download ProRealTime software?
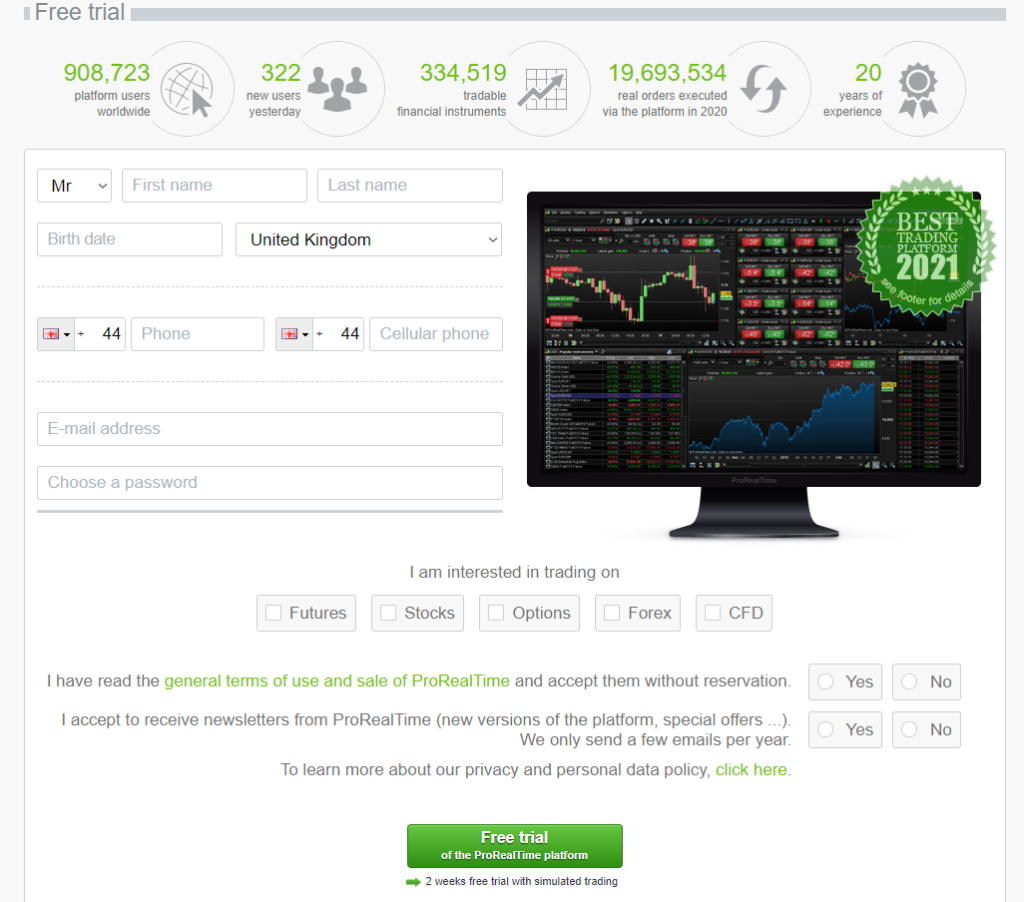
First of all, to be able to download ProRealTime, we need to create a free account by clicking here.
Once you access the ProRealTime page, you will need to fill in the information they request, which is our name, our birth date, our country, and an email address. After that, we will be able to choose which financial instrument we are interested in. Once filled, we can proceed and click on the free trial.
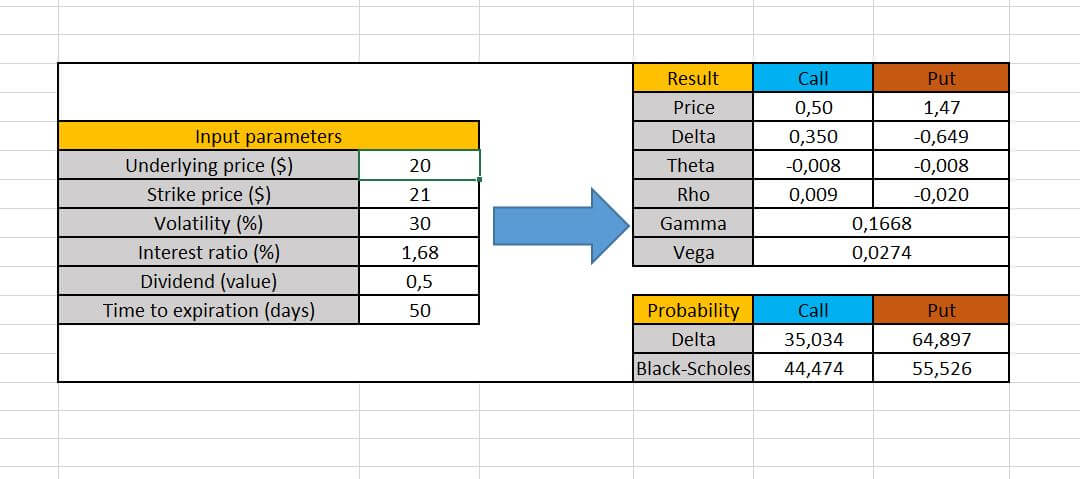
It does not really matter which choice we click, we will have access to every single instrument later. One thing that we must take into account is that this trading software does NOT support stock options trading.
Once we have created the account, we will be able to login into ProRealTime and we will be able to download and launch the platform.
Overview of the ProRealTime platform
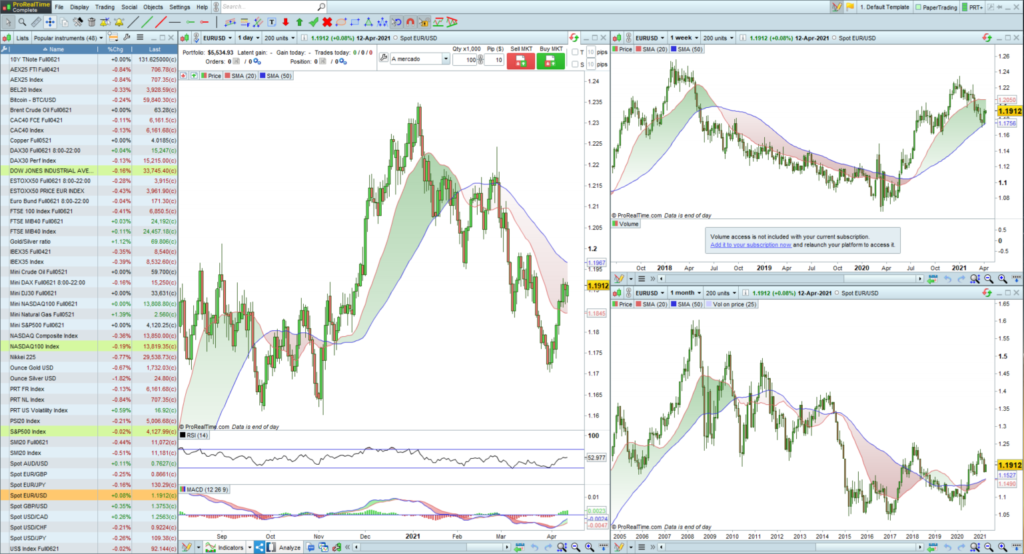
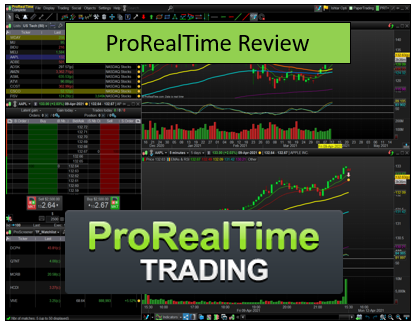
The very first thing that we will find once we have run the platform is a toolbar, a list of the most popular instruments in the market, and three graphs displayed with some technical indicators on them.
Changing the appearance of the platform
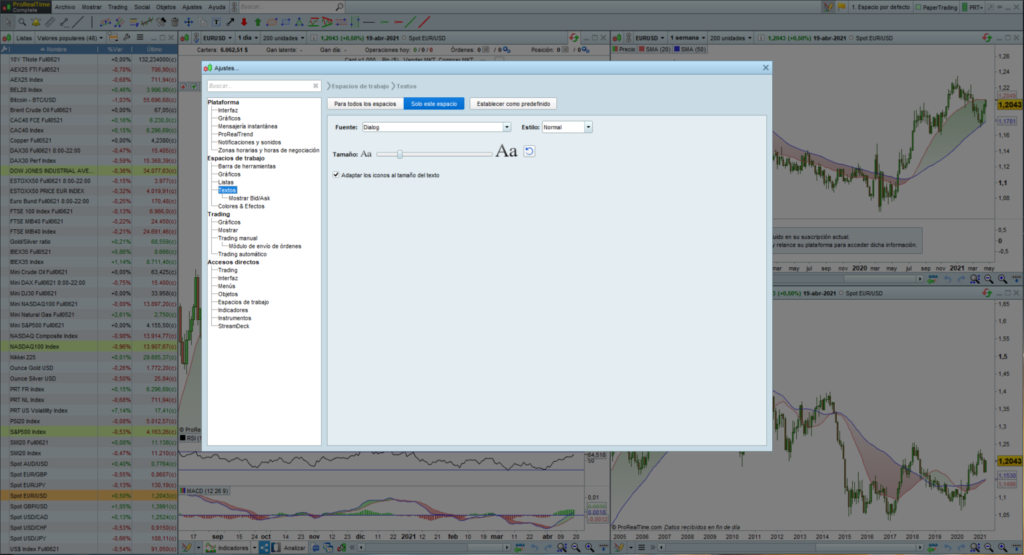
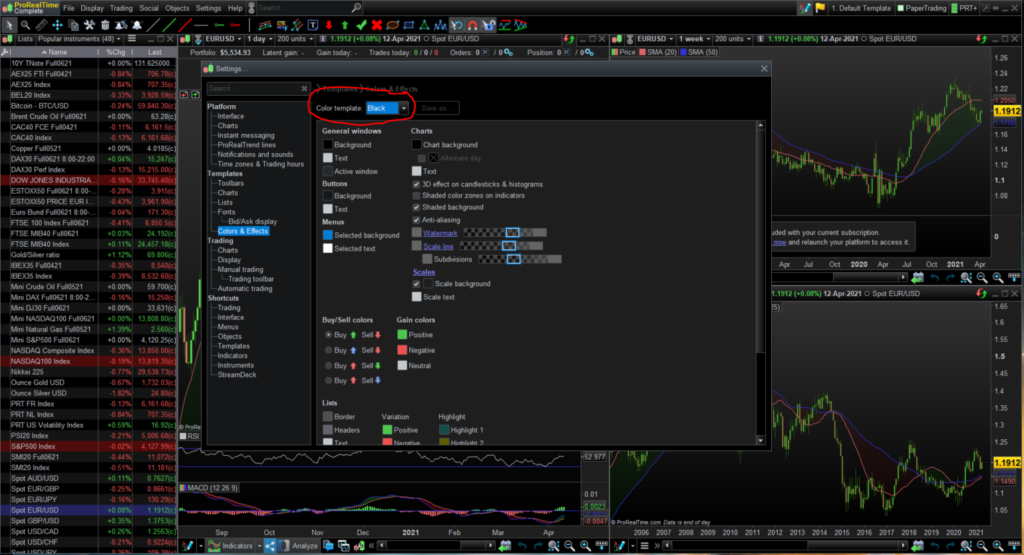
First of all, we are going to be configuring the appearance of the platform so you can change it to your likings. We will first go to “settings > platform” in the toolbar above.
After that, a box with many options will be opening. Here, we can change absolutely everything about the appearance of the platform. For example, if we want to change the font size, we can click on “templates > fonts” and move the scroll bar to one side or to the other.
Also, we can change the color of the platform background. If we click on “templates > colors & effects”, we will be able to change every single color in the platform. We recommend you use the color template if you do not want to complicate yourself.
We are going to set it to black because it is good for our eyes and we probably are going to be spending quite a lot of time in front of the screen.
Sometimes, if we change some elements in the settings panel, we might find that our graphs move and overlap between themselves. We can change their position by clicking on the tab and dragging them where we want or we can click on “settings > multi-window multi-screen” and we can make them fit the current screen size.
Adding and changing the lists
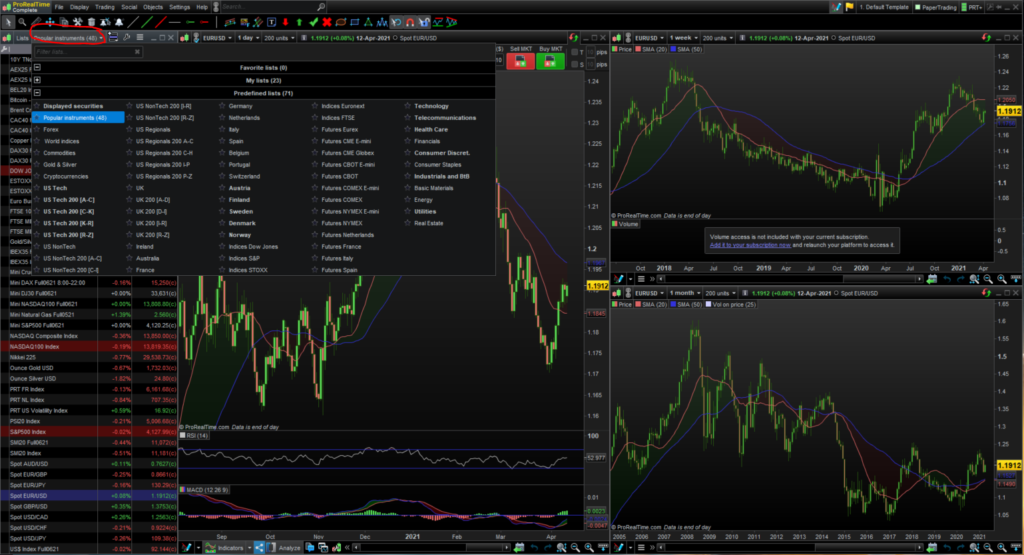
On the left side of the screen, we will find a list of the most popular instruments. If we wanted to change this default list, we can simply click on the tab and choose another list available.
We are going to choose the United States Tech as an example. The list will display the 50 most important technology companies in the country.
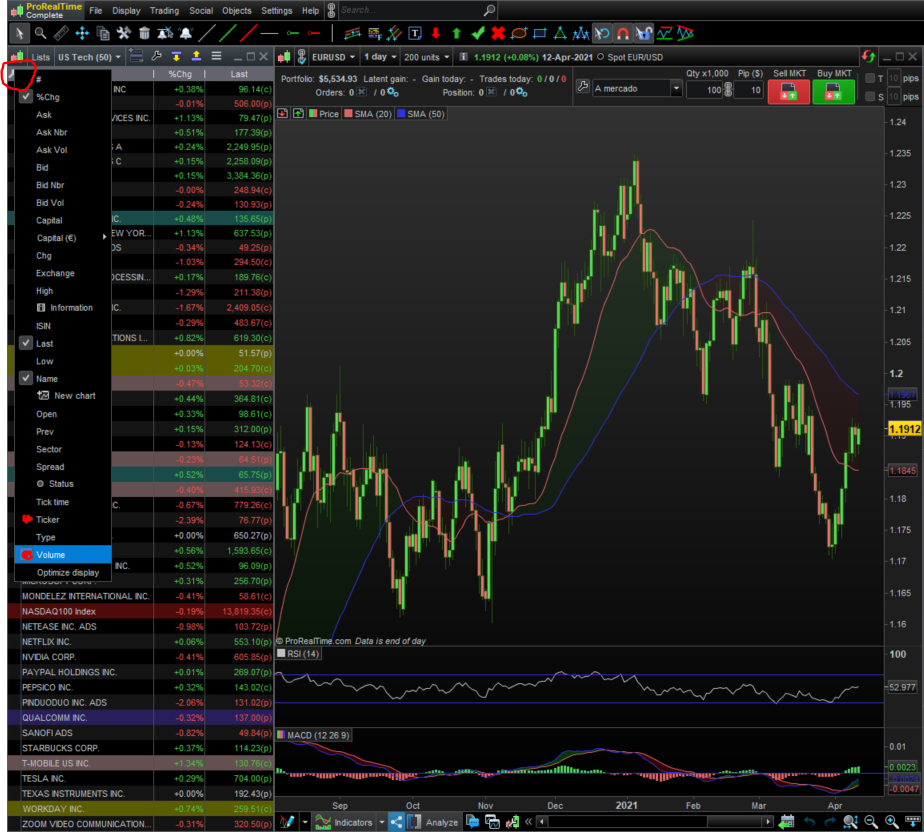
In the list, we will have displayed the name of the company, of how did it change from the previous close and the last price traded. But if we want, we can add or remove more information on the list.
For example, we are going to add the volume traded and the ticker of the company. To do so, we are going to click on the wrench icon and choose these two options.
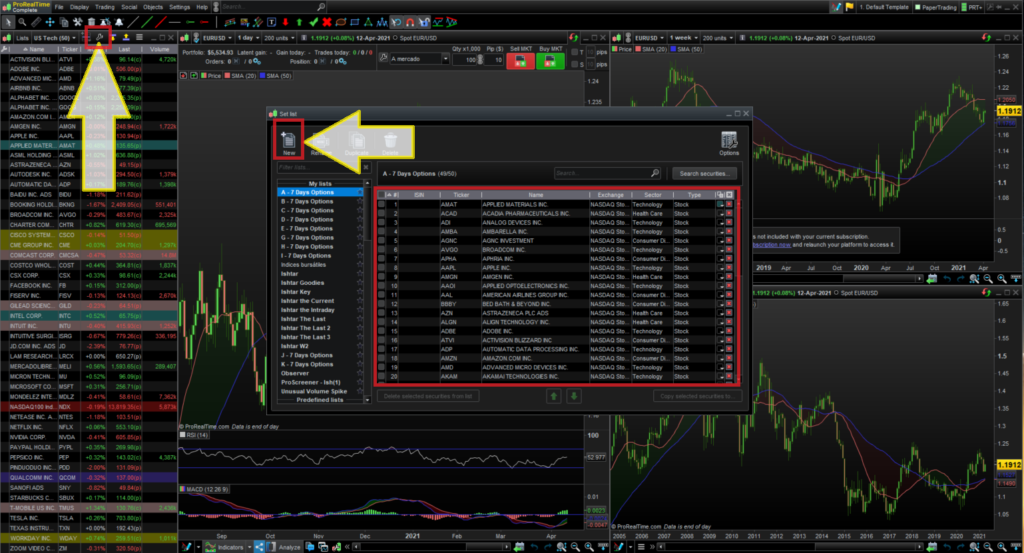
The list now will contain the additional information that we have added. We can also create our own list by clicking on the upper wrench and clicking on new.
In that way, we can create our own watchlist to track the assets we are interested in.
Configuring the graphs: Changing the price visualization
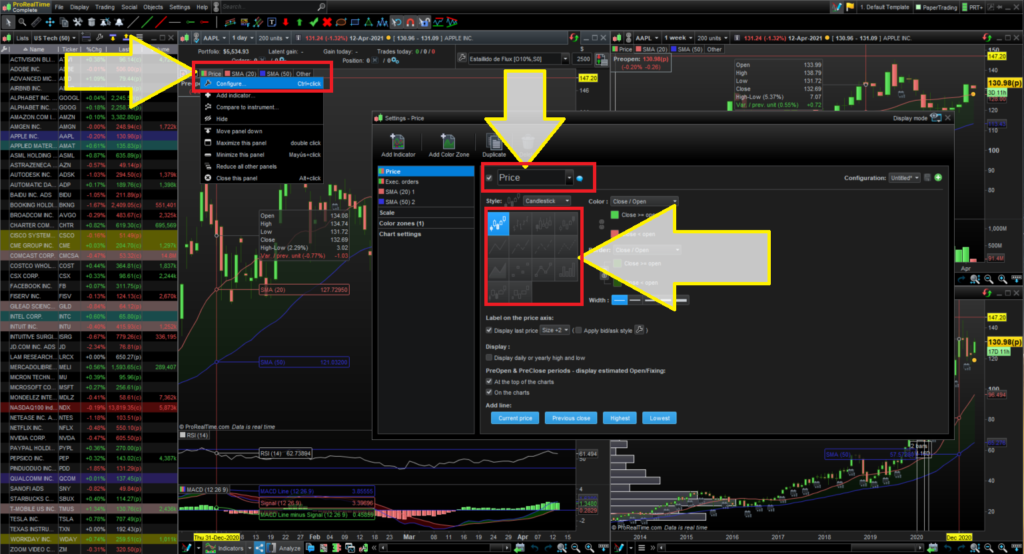
With ProRealTime software, we can change the way we visualize the price. By default, the software will choose the Japanese candlestick representation, but if we want, we can change it to bars, to Heikin-Ashi, or whatever we need.
To change the price, we will need to click on the price and then, click configure. A new dialog box will be opened and there, we will be able to change the way we represent the price or even change it to a Renko chart.
We are going to leave these parameters as default because we are happy with the Japanese candlestick display. Note that we can also change color and several other settings in the price.
Changing the time frame of the graph
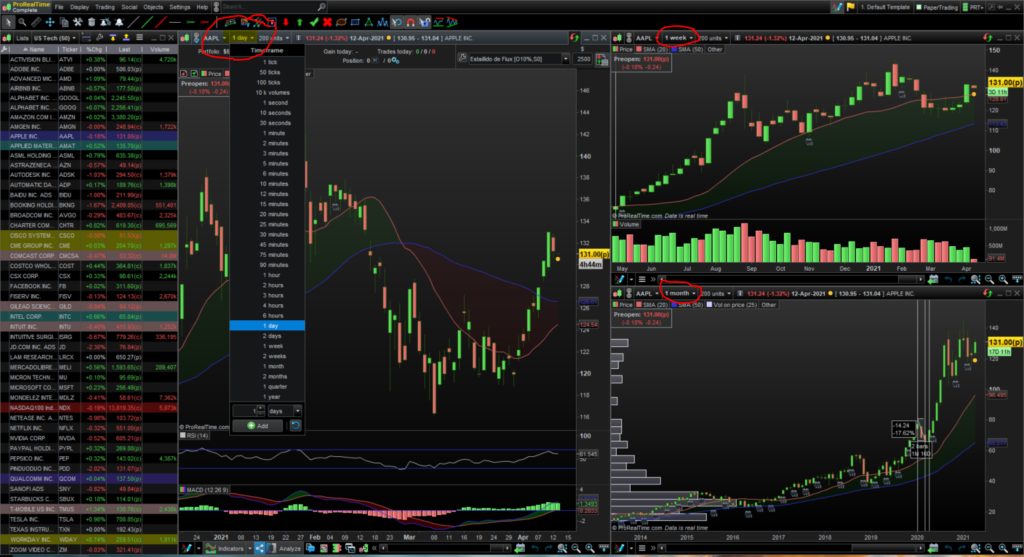
We can easily change the timeframe of the graph by clicking next to the name of the ticker in the graph. We will be able to choose between any data we want.
Take into account that if we have not requested the real-time trial, we will not be able to visualize intraday market data.
Adding or removing technical indicators into the graphs
Indicators on price
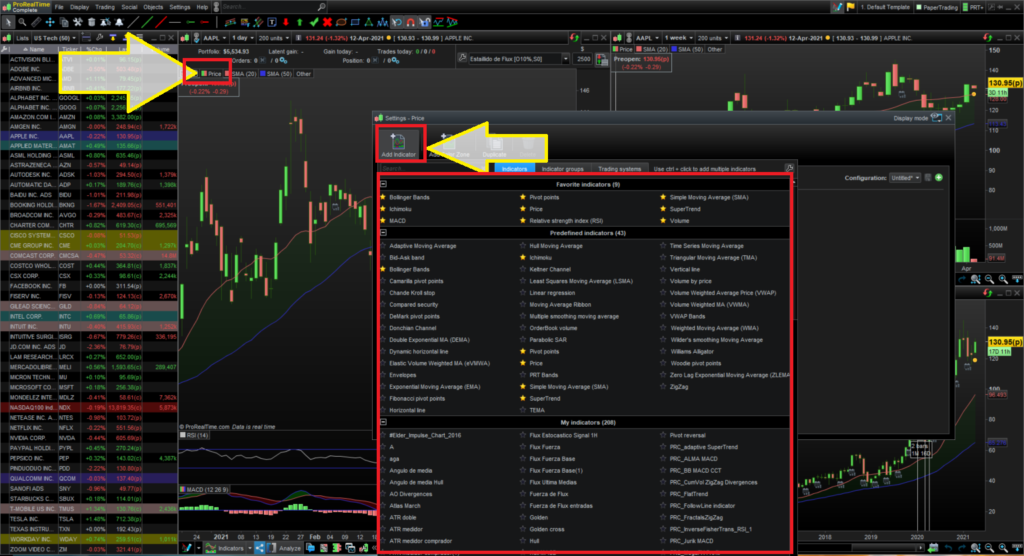
In ProRealTime software, we can either add technical indicators into the price, such as the moving averages or support/resistance levels (these ones can be automatically calculated by clicking on a button on the toolbar) or we can add other indicators such as the MACD or the stochastic indicators.
If we want to add them to the price, we will need to click on the price and then on “Add Indicator”. A new list will display and we will be able to choose whatever indicator we want.
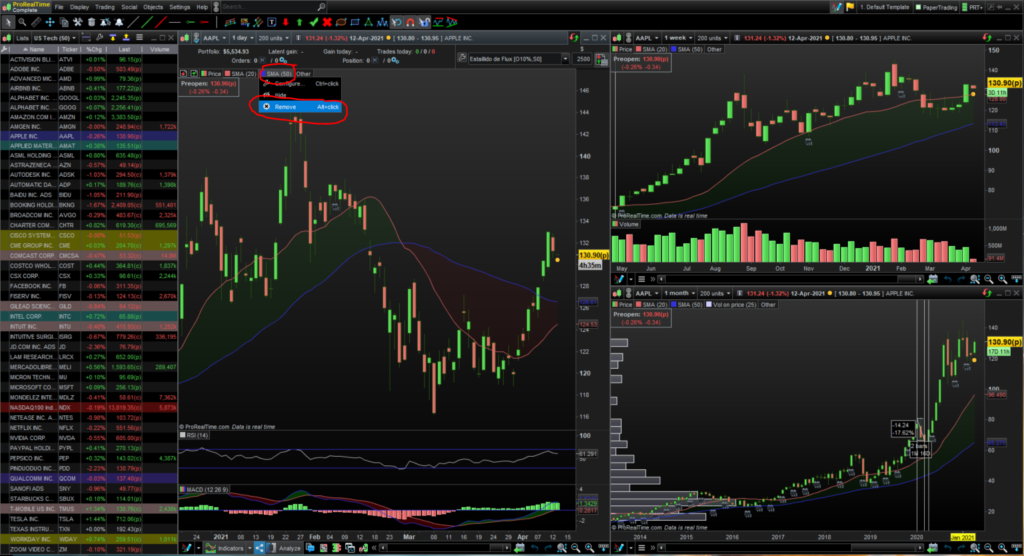
Once added, the indicator will appear just next to the price. If we wanted to remove them, the only thing we need to do is to click on the name of the indicator we do not want to see more and click on remove.
Indicators outside price
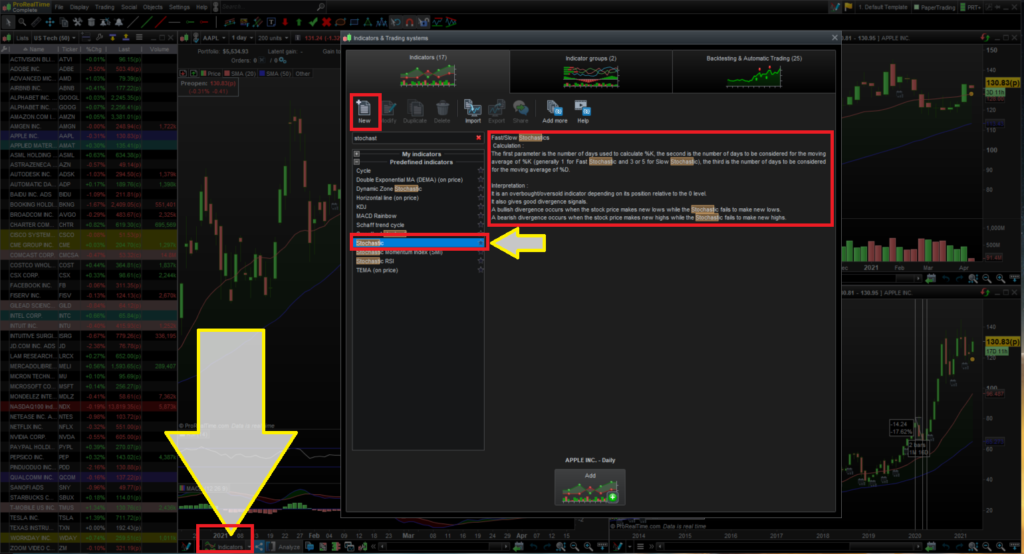
If we need to add more indicators into a graph, the only thing we need to do is to click on the “indicators” tab at the bottom of the graph. After that, a new dialog box will open, and here we will be able to either pick one of the default indicators or create a new one.
We are going to choose the stochastic indicator and add it to our graph. We will see that before adding it, there is a description of how to use it and interpret it correctly.
Once that we have added the stochastic indicator to the graph, we can configure every setting we want. If we click on the indicator and hit “configure” a new dialog box will open where we will be able to change some parameters specific to the indicator, such as the %K or the %D or the method used to the smothering.
If you need more information about how to configure the stochastic indicator, we have a guide here.
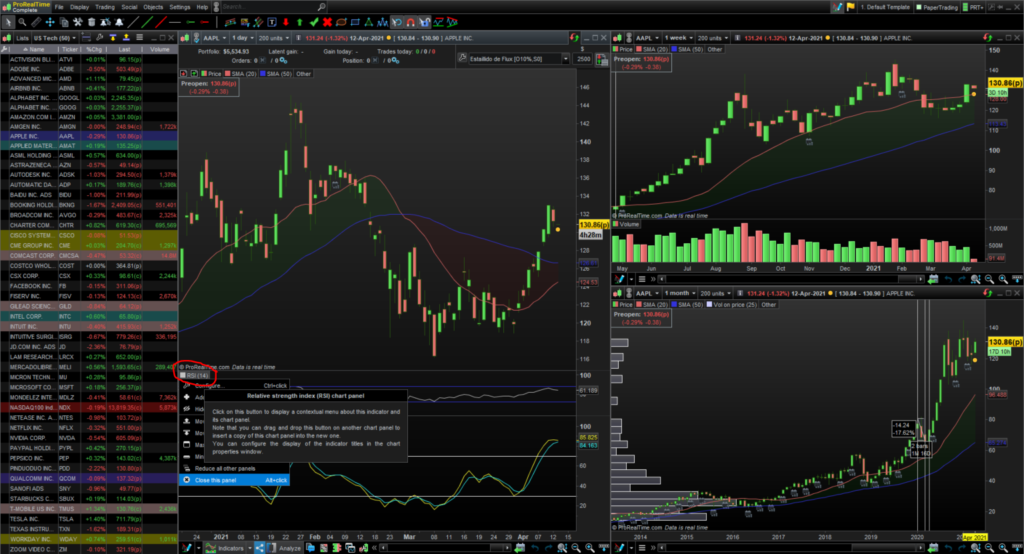
We now may want to remove the RSI and the MACD indicators because we are not going to include them in our trading strategy. To do so, the only thing we need to do is to click on them and then hit “close this panel”.
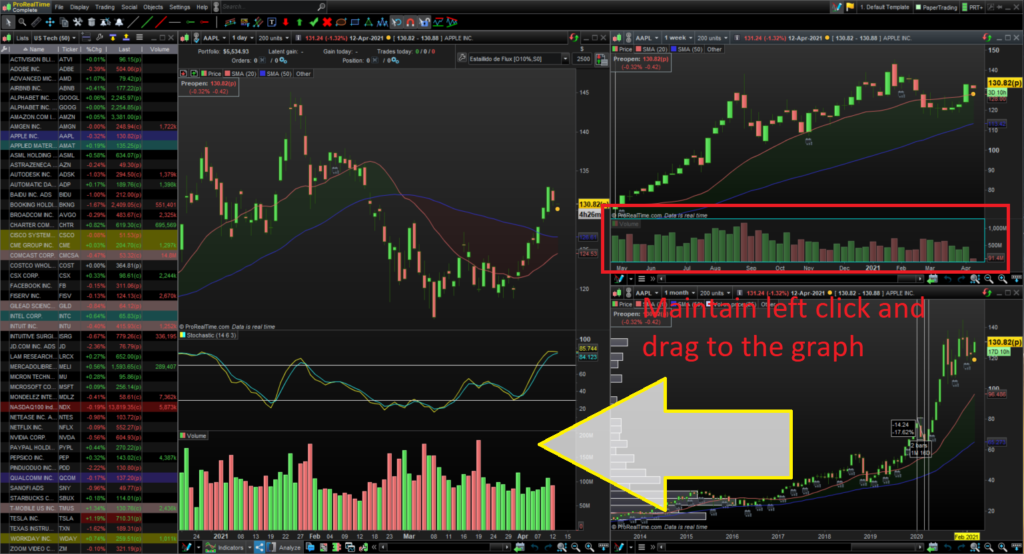
Okay, now we only have the stochastic indicator displayed on the graph. Now we want to add volume.
One of our right graphs has the volume indicator displayed on them. If we left-click on the volume in that graph and then drag it to the graph in which the stochastic is displayed, the volume indicator will duplicate and we will not need to open the list and pick it again.
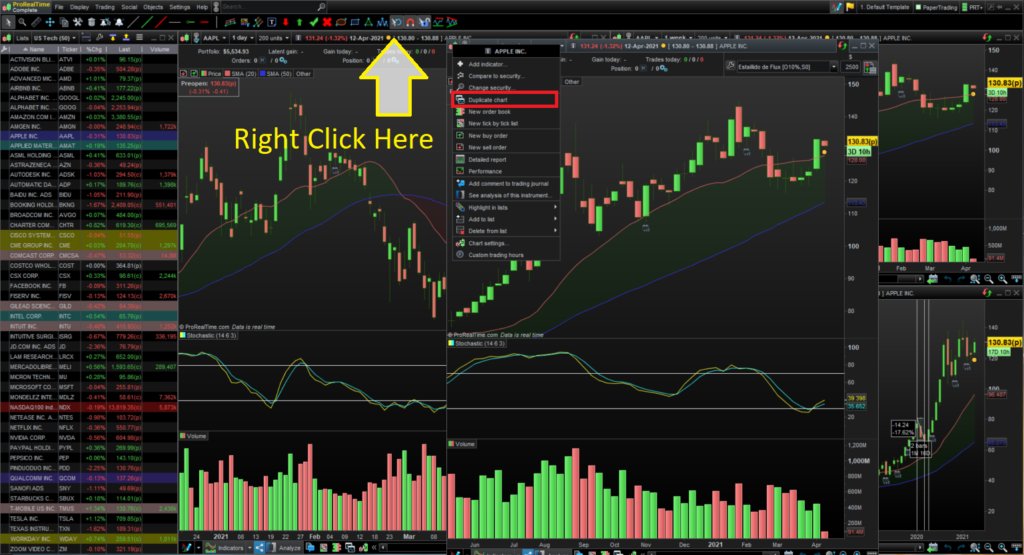
If we are happy with this configuration of indicators and we want to copy them into the other graphs, we can always right-click on the graph tab and duplicate it. After that, we can change the timeframe of the graph and we will have it all set.
How to import indicators to ProRealtime
Some indicators are not available by default in the ProRealTime software and sometimes, we may need to import some codes into the platform to be able to use it.
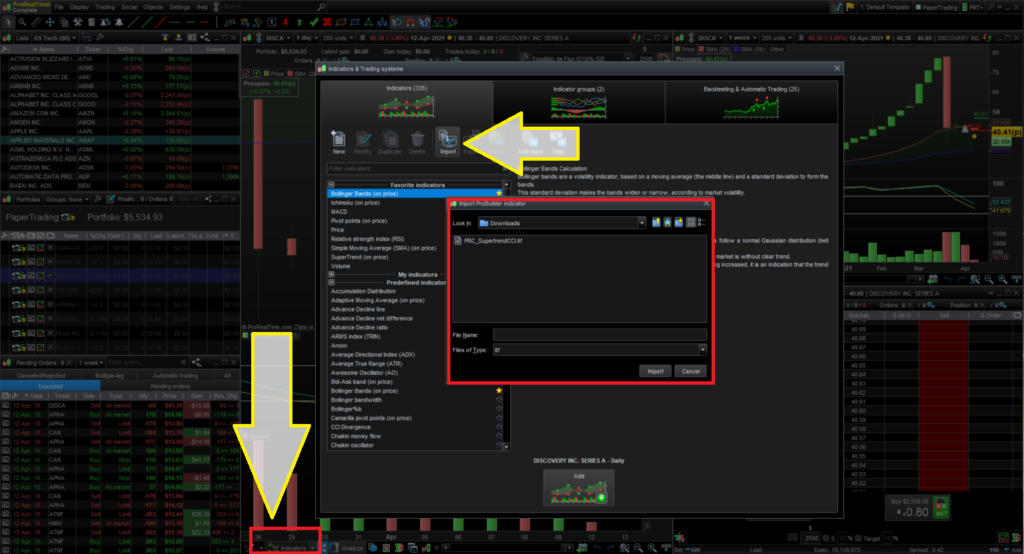
To do so, the only thing we need to do is to access the technical indicators list in the bottom tab of a graph. Then we will click on import and a new box will open. To import the indicators, we need to look for them on our computer. The extension of these files is “.itf”.
Once we have it, we will only need to click on Import. Then a message will trigger telling us that the indicators have been imported. We must open one more time the indicators list and then look for it to add it into the graph.
We have some useful indicators such as the TTM Squeeze or the RSI divergences that you can download for free with our Stock Trading Guide here.
Trading with ProRealTime
Now, we are going to be deepening a little more on how to use the trading tools that ProRealTime offers us, such as the order types, the portfolio, and the orders in general.
Setting the trading tools in ProRealTime
First of all, we are going to be displaying everything we will need to trade in this software. We are going to shrink the watchlist to have more space.
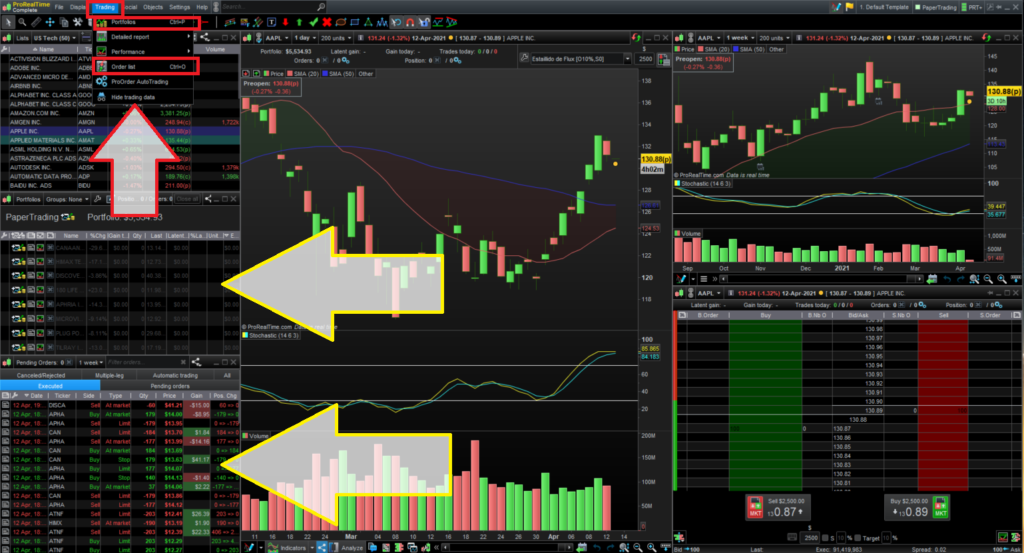
In the trading tab, up in the toolbar, we will pick the portfolio, to be able to see the open positions we have in the market and order list to have every order located.
Again, we can configure both the portfolio and the order list configuration by clicking on the wrench, just like we did with the watchlist.
In the order list, we will be able to see the executed orders and the pending orders. We always like to have the pending orders window active to take a fast look at everything open in the market.
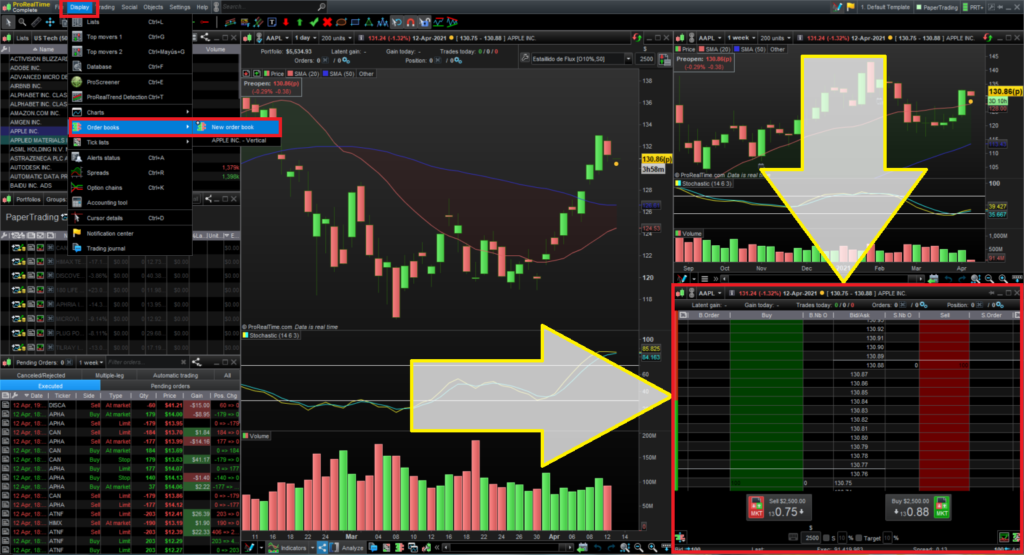
We have also included the market level II, which you can display by clicking on “Display” in the toolbar (next to trading) and clicking on “Order books > New Order Book”.
Issuing orders into the market
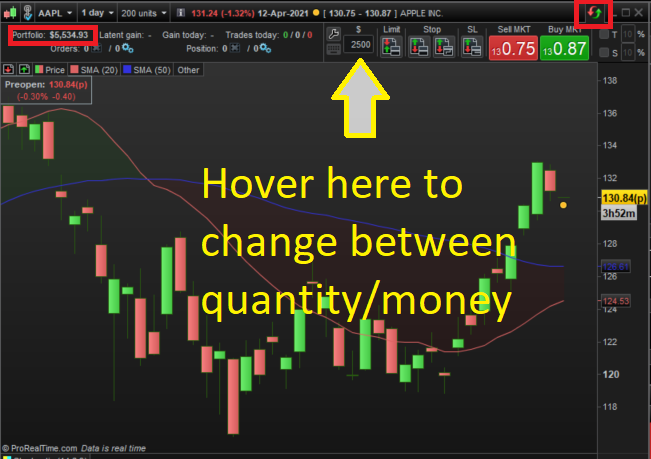
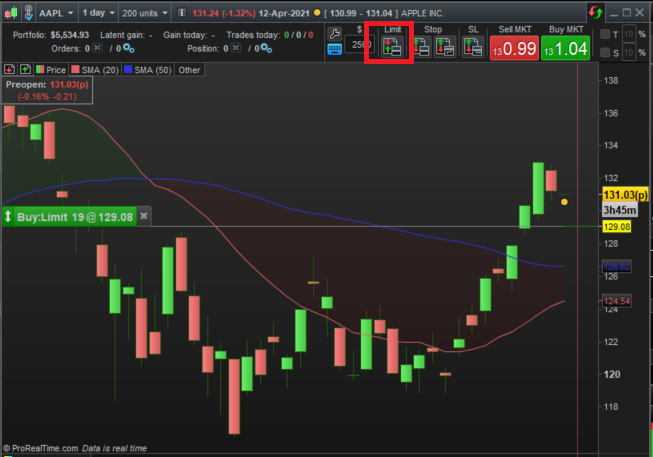
In the upper tab on any graph, there is a small icon of two arrows, one red and one green. If we click on that icon, a new toolbar will be opened in which we will be able to issue orders into the market.
In this toolbar, we will be able to see the quantity of our portfolio as well as other parameters such as the position, the trades, and so on.
By default, ProRealTime includes market orders, limit orders, as well as stop loss and stop-limit orders. We will be able to choose the number of shares we want to trade or the money we want to spend in the order if we hover the click over the quantity.
If we launch a market order, it will be immediately executed, but if the issue a limit or a stop loss, we will be able to choose at which price. If we place the order over the current price, the order will automatically change to a short, but if we place it under the price, it will be a long order.
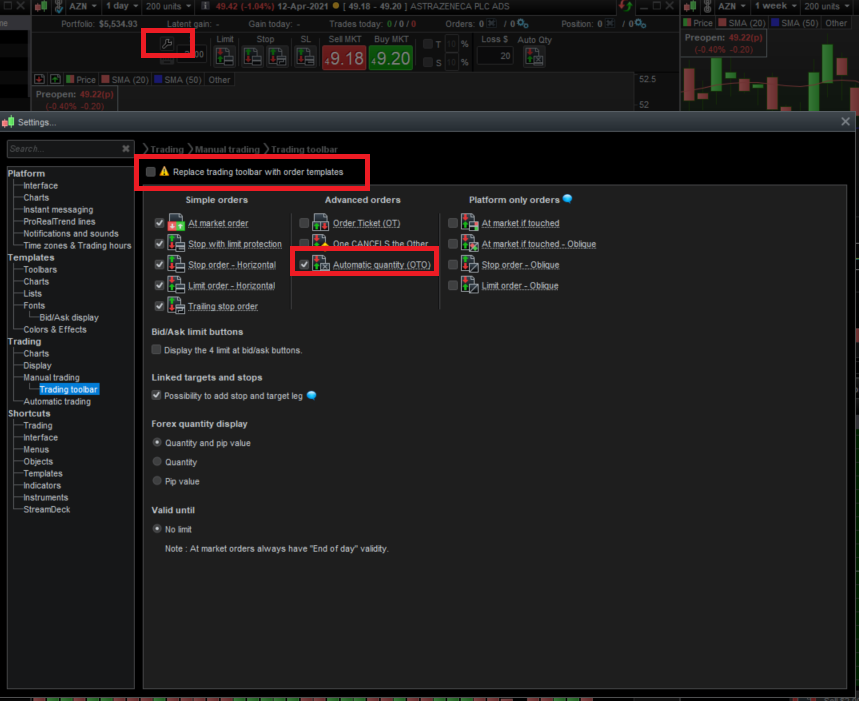
One of the most interesting features of the ProRealTime orders is that we can create our own predefined order. If we click on the wrench, a dialog box will be opened.
In it, we can add more by default orders such as the Automatic quantity that will automatically will calculate the number of shares attending to the risk we want. If we want to create our own orders, we will need to click on “replace trading toolbar with order templates”
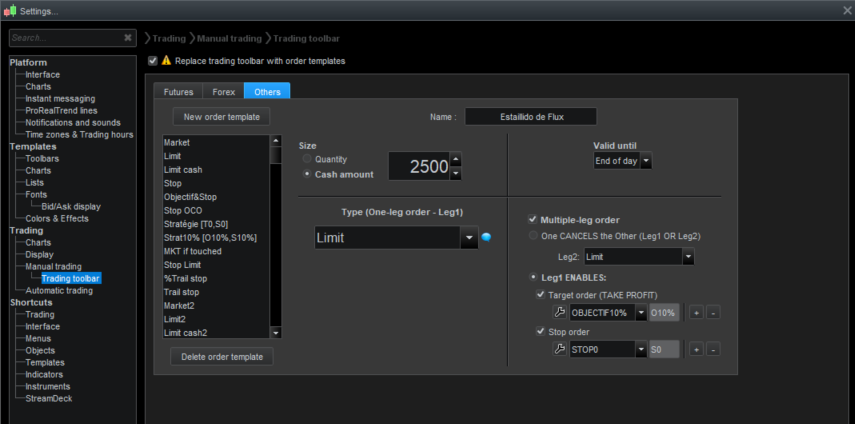
Once we do so, a new tab will appear. If we click on “New order template”, we will be able to create our predefined order, in which we will be able to choose the default size attending to quantity or cash amount, the type of the order, or if we want to add a “Once cancel the other” statement after we enter the trade.
Filtering signals with the ProRealTime Screener
Using the ProRealTime Screener plus the predefined tools that the software provides us will allow us to find any trading opportunity we want.
If you want to learn how to properly use all the filters and signals that ProRealTime software provides, take a look at this article, which is completely dedicated to filtering signals.
Summary of the ProRealTime tutorial
As you can see, this trading software is extremely versatile when it comes to configuration and trading in general.
The aim of this tutorial was to help you start setting everything up, but as you can see, there is still a lot of things yet to cover.
If you want to learn about all the features, we highly recommend you to access the ProRealTime page and look for the User Guide under Help and Support in which you will find absolutely every feature explained.
